Mirovα, Creating Sustainable Value - March 2024
Monthly market review and outlook

The Magnificient 7 and HY: again winners
February was a very good month for risky assets, setting new records for the leading market indices. The S&P 500[1] exceeded 5,000 points for the first time in its history, having risen 5.2%[2] over the month, while the Nikkei reached levels not seen since 1989. These performances are notably due to continued enthusiasm for the theme of artificial intelligence (read The Long View) and the ongoing attraction of large American capitalisations. In particular, following the solid results from Nvidia, Meta and Amazon, the ‘Magnificent Seven’ are still significantly driving the American index (+12%).2 Looking more closely, however, not all experienced as positive a start to the year as Nvidia (+60% at end February)2 like Apple or Tesla that clearly faced more of a struggle.
Overall, large broad caps continued to outperform. So did cyclical values, relative to defensives. The S&P 500 thus continues its fourth consecutive month of gains. It should be noted, however, that regional bank shares remain under surveillance: their index lost 3%2 over the month after a 10%2 drop in January.
In Europe, the equity market saw a more modest increase of +2%,2 despite a clear outperformance of cyclical and mega cap stocks that proved a positive surprise overall (ASML, Novo Nordisk, LVMH, SAP ...). Full-year results appear more mixed on average than stateside, as growth struggles to shift up, although we note a slight improvement. Further east, markets have witnessed a sharp increase. The Nikkei grew by 8%,2 as did the Chinese market, which posted its best monthly performance in two years. This rebound might best be described as ‘tactical’ for now, following as it does a heavy-handed intervention by the government, which has notably made stock purchases.
In the bond markets, investors had to cope with a slight surge in inflation during the month on both sides of the Atlantic, leading them to once again postpone their first key rate cuts, now scheduled for June for both the Fed[3] and the ECB[4] consensus. The willingness of central bankers to wait a few extra months to ensure the return of inflation to target levels proved a boost. Faced with the rise in short and long rates (40 bp for US 10yr to 4.3%2; 23 bp for the German 10yr to 2.41%2), government bonds have lost ground, dropping by 1.5%2 for US Treasuries[5] and 1%2 for European bond indices. However, it’s worth observing the continued tightening of credit spreads[6] over the month, both for investment grade[7] and high yield,[8] with a primary market that remains vigorous but struggles to satisfy investors’ appetite for these asset classes.
Meanwhile, the rise in short and long rates has not affected the equity markets, putting an end (at least for now) to the unusually strong and positive correlation between equities and bonds which we witnessed throughout the past year. Indeed, equity markets grew despite rate hikes, finding their own catalysts for performance in the macro as well as microeconomics. Investors demonstrated their belief that the economy is doing well and the market returning to healthier behaviours.
On the currency side, the dollar rose 1%,2 emerging stronger against the G10 currencies after the rising of US rates over the month. The yen continues to fall, losing 2%2 in February, bringing its decline to 6%2 since the beginning of the year. This benefits stocks, as demonstrated by the Nikkei’s performance.
Brent grew by 2%2, unlike commodity prices generally, especially natural gas in Europe. The price of the latter fell by 18%2 over the month, reinforcing the hypothesis of ongoing disinflation, with a decrease in production costs for energy-intensive sectors and renewed purchasing power for households.
Last notable fact of the month, the exceptional performance of bitcoin. With an increase of 45%,[9] to more than $60,000, the cryptocurrency achieved its best monthly performance since December 2020.

Monthly Chart
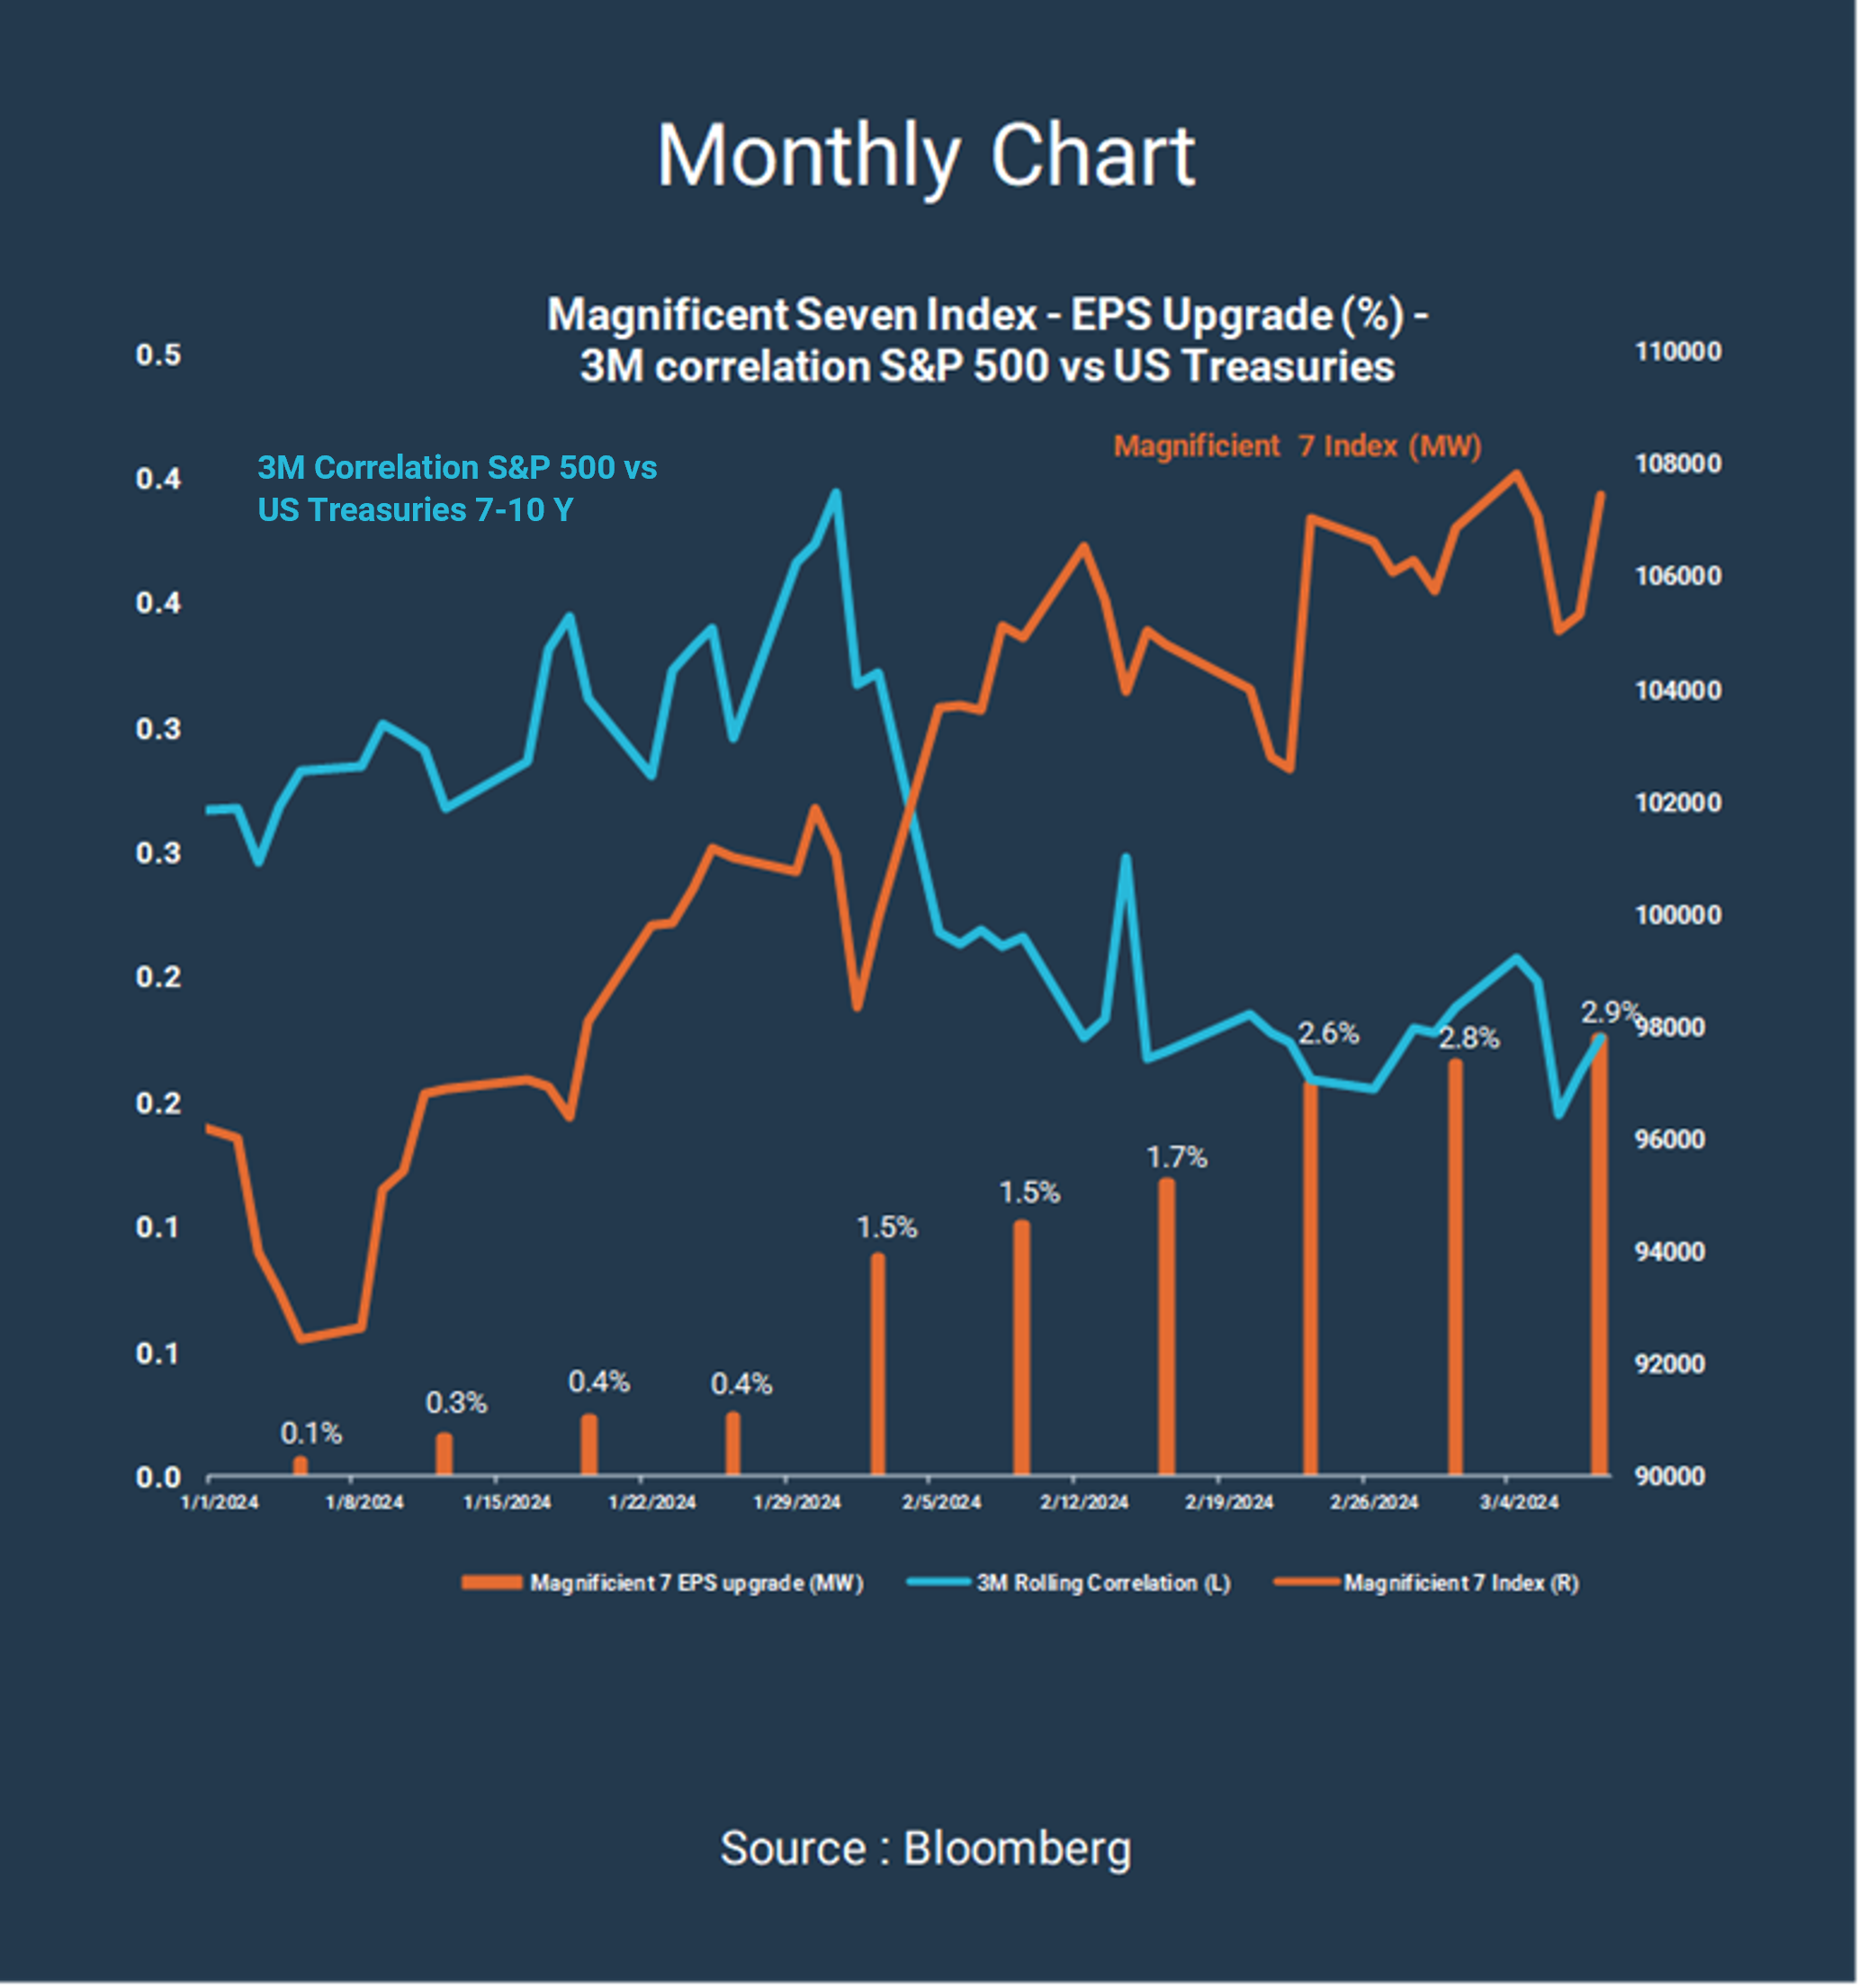
Source: Bloomberg
Market review & Outlook
Surprise inflation : why not to worry
Unexpectedly, core inflation10 for January and February delivered a surprise increase. In the United States, the CPI11 came out at 0.4%12 for both months, versus expectations of +0.3%12 (monthly basis), a nine-month high. Over three months, annualised core CPI climbed to 4.1% per annum.12 Given a PPI13 that also significantly beat expectations and an underlying deflator of household consumption (core PCE14 deflator) at 2.8%,12 still above the Fed’s objective, it seems legitimate to wonder whether the disinflation dynamic is still in operating at the beginning of 2024.
Investors, taking their lead from central bankers, have repeatedly postponed the expected date of a first key rate cut (now June according to consensus for the Fed and ECB) and revised their estimates as to the extent of reductions. The latter have dropped from about 160 basis points12 at end December to 90–100 basis points12 expected cut for US and European policy rates. The number of anticipated cuts in 2024 followed logically, dropping to four on both sides of the Atlantic whereas it stood around six at the end of last year.
In our view, however, the figures of the beginning of the year should not be seen as the return of an inflationary trend, nor the beginnings of a scenario like that of the 1970s, with a price-wage loop. Rather, they demonstrate that the normalisation will take longer than anticipated and will appear more erratic as well. In addition, this inflation must be recognised as related to seasonal price increases and is partly due to the increase in specific contributions to be made during this period, such as portfolio management and insurance fees. Renewed inflation is not part of our central scenario. The slowdown in unit labour cost growth in the United States (related to productivity gains and the gradual normalisation of the labour market) should instead continue to exert slight downward pressure on inflation in the coming quarters.
Furthermore, according to the Fed’s15 Beige Book,16 companies are reporting greater availability and retention among the workforce, consistent with an observed decline in the rate of employee resignations. Several states also note easing inflationary pressures, in part because companies struggle more and more to pass on cost increases to customers. Supply chains continue to normalise and the decline in commodity prices, a major disinflation factor in developed economies over the past two years, is expected to continue this year.
Also, non-agricultural job creation was paired with more moderate wage growth (0.1%12 over february, 4.3%12 year-on-year, versus 4.4%12 in January), an increasing reliance on temporary workers and an increase in the unemployment rate.
All in all, these inflation surprises do not seem to worry the US central bank too much. Jerome Powell made clear in early March before the Congress that inflation had declined ‘substantially’ after reaching a 40-year high in 2022, and that the Fed was ‘not far from having the confidence to cut rates’.
The ECB followed suit at its committee meeting in early March by lowering its inflation (and growth) forecasts for the euro area this year. The expected inflation for 2024 is now located in 2-3%12 against 2-7%12 only 3 months ago while expectations for 2025 and 2026 fell to 2%12 and 1.9%12 respectively.
United States: a possible ‘no landing’ scenario?17
US growth is expected to well exceed 2%18 this year (excluding exogenous shock), more than double the consensus of a few months ago. Certainly, growth to date is significantly higher than the initial forecast. The 3.2%17 annualised growth achieved in Q4 2023, much of which comes from private consumption, partly explains this discrepancy, as does data from the first two months of 2024, consistent with growth of over 2%17 . As a reminder, manufacturing and services PMIs, including new order components, increased in parallel with the publication of good employment figures, dynamics of mortgage refinancing, improved financial conditions and positive wealth effect for households, etc….
In the labour market especially, we have seen strong job creation, despite a slight increase in the unemployment rate. According to the U.S. Bureau of Labor Statistics, non-agricultural payroll gained 275,000 in February after a revised but still decent rise of 229,000 in January. Average job creation over the past three months stands at 265,000, above the 12-month running average (229,000).
Another positive indicator is the CEO confidence index, a measure of economic outlook in the United States (quarterly survey based on expectations for the following 6 months), which now exceeds its historical average for the first time since 2022.
Under these conditions, some are wondering whether the US economy would not be on the verge to take off again and as a result take inflation with it. Raphael Bostic of the Atlanta Fed has cited a ‘repressed exuberance’ awaiting only the signal of a drop in key rates to materialise.
At this point, it seems too early to draw conclusions. One of the key variables for the coming quarters could be whether the productivity gains achieved by the U.S. economy continue. The past three quarters have yielded an annualised rate of 4%,17 equivalent to that of the late ’90s, which were marked by a continuation of the cycle well beyond expectations. In any event the conditions seem already met for a successful soft landing scenario, with a real possibility of no landing, and we remain more aggressive than the consensus in this regard.
Europe: still finding its way forward
In Europe too, disinflation has faltered somewhat since the beginning of the year, but without this being a point of concern. Seasonal effects are an important component in the slight rebound in inflation.
More than these temporary movements in inflation, the Central Bank is now carefully scrutinising employment and wages. On this front, the figures still show significant strength, which explains why no rate cut is likely before the beginning of June. Despite economic stagnation in the euro area, unemployment continues its downward trend, standing at 6.4%17 in January, after reporting 6.5%17 last December. Faced with structural tightening of the labour pool, companies are retaining their employees, or even hiring in anticipation of an economic recovery in the second half of the year.
This tightening of the labour market is favourable to employees, who still hold the high ground in terms of salary negotiation. Christine Lagarde’s bellicose discourse in the face of a future rate cut is largely attributable to these elements. The ECB19 will be very attentive to the results of wage negotiations taking place during this first quarter. Wages could rise between 4%17 and 5%.17 However, to align with an inflation target of 2%, the ECB favours wage growth of around 3%.17 We believe that wage levels should normalise in the euro area, as is beginning to occur in job offers, validating the assumption of a rate cut in June. In the euro area, inflation might fall around 2%20 by the end of the year, without declining to levels seen in the pre-covid era.
On the broader growth front, a recovery is expected, but we seem to have passed a low point, as evidenced by the latest PMI index publications, which show a slight rebound, as well as a simmering recovery in services.
The February Composite PMI Index reached its highest level in 8 months. This is combined with improved manufacturer sentiment, even if gains remain low. The increase in new orders is a positive point as is the decline in wholesale energy prices, which should ultimately benefit energy-intensive industries. One area to look out for in the coming months is construction and real estate, especially in Germany and France. The number of building permits is down, while the number of real estate loans is low. A relaxation of credit conditions would be a strong positive signal in favour of recovery.
China: Seeing through the market rebound to reality
In China, the strong monthly performance of domestic shares, partly related to measures put in place by the authorities to stabilise the market, should not make us forget the economy’s structural difficulties. Chinese households are suffering a negative wealth effect related to the collapse of real estate and domestic consumption is struggling to rebound. On the supply side, industrial data remains poor, with a manufacturing PMI index that contracted for the fifth consecutive month in February (at 49.1, still below 50).
The trend of consumer prices is close to zero, contrary to Western countries, while that of production prices is down over a year. Fiscal stimulus plans that serve supply, not demand, have so far only accentuated this trend. This causes some to say that China should continue exporting its deflationary pressures to the rest of the world this year, via a rebound in exports.
Finally, the Chinese government has set a GDP21 growth target of 5.0%19 for the second consecutive year. This objective was reached, or even exceeded last year, but a priori seems more ambitious this year. One certainty: further monetary and fiscal stimulus is on the way, including potentially direct support for household consumption, should spending dynamics weaken in the coming months.
Markets are scrutinising company results
Earnings season is coming to an end in the United States and results have exceeded expectations. Three-quarters of companies posted better-than-expected results and more than half exceeded revenue forecasts. The anticipated growth rate for US companies in 2024 is 10%19 to 12%.19 Consequently, we should note an increase in valuations in the technology compartment, despite the 40 basis points increase on US 10-year rates. This phenomenon demonstrates that investors are willing to pay more to participate in this growth. Such valuation levels do put some pressure on the companies involved—a reduction in rates would partially reduce this.
In Europe, three-quarters of companies have published their results, but only exceeds expectations. On turnover, again, just under half surpassed their forecasts. This is the weakest quarter since T4 2019 and further downgrades are possible in company forecasts of anticipated growth for 2024.
The Long View
Investors: time to turn off the caps lock?
The small & mid-cap underperformance of the past several months now has the look of a fundamental phenomenon, fuelled by coherent factors and framed by rate increases. It also has rather mechanical aspects. Simplifying in the extreme, you might say it comes from sales of the smallest securities by investors seeking to expose their portfolios to the very strong growth prospects of Artificial Intelligence (AI). Indeed, there is no longer a company, a university or government-like organisation that validates the launch of major research or development projects without incorporating an AI-based component. However, this requires access, for example, to Nvidia’s products; if the latter deigns to provide them with a reasonable deadline and at decent prices. Everyone quickly grasped that never before had prospects for the development of an industry seemed clearer, this time even eschewing the bold assumptions markets made in the early 2000s to model the price of so-called Internet securities.
Conclusion? No equity investor can dare to forego Nvidia shares. And because we’re in a period when all-round money creation appears stalled, we must find enough to finance the strengthening on Nvidia or a roughly equivalent large-cap company. In this context, shedding small & mid-caps is an option all the more rational as the increase in rates penalises these values, which are often perceived as a way to bet on growth or consolidation. Moreover, it is worth remembering the 1970s, which demonstrated that a company’s ability to preserve or even increase its margins in inflationary times depends mainly on its size. With a few exceptions, the largest players outperformed their smaller peers. Finally, in some sectors, relative debt levels do not favour small companies, which are more indebted on average than the largest of their competitors. The divergence induced by this behaviour – the sale of small & mid-caps to finance the purchase of large caps – should come as no surprise. It feeds itself.
The question then becomes what might curb this loop. There is no need to resort to sophisticated forecasts: it’s the evolution of rates, not the levels reached already that provides the obvious foundation for a possible return to grace of small & mid-caps. However, two situations must be distinguished: one in Europe, the other in North America.
Playing technology stocks, or American growth story?
Although sharing many characteristics, small and mid-sized capitalisations have valuation dynamics based on different underlying factors, depending on whether we are talking about Europe or North America.
European Small & Mid-caps: playing low rates.
For a long time, European small & midcaps made it possible to play very domestic trends, but Globalisation put an end to this: little by little, this segment of the market became a vector of exposure to global growth, while adding an innovation component that was lacking in broad caps.
So, it’s no surprise that rising rates penalised these values to the point that their valuation multiples show record discounts, and we became simply bewildered.
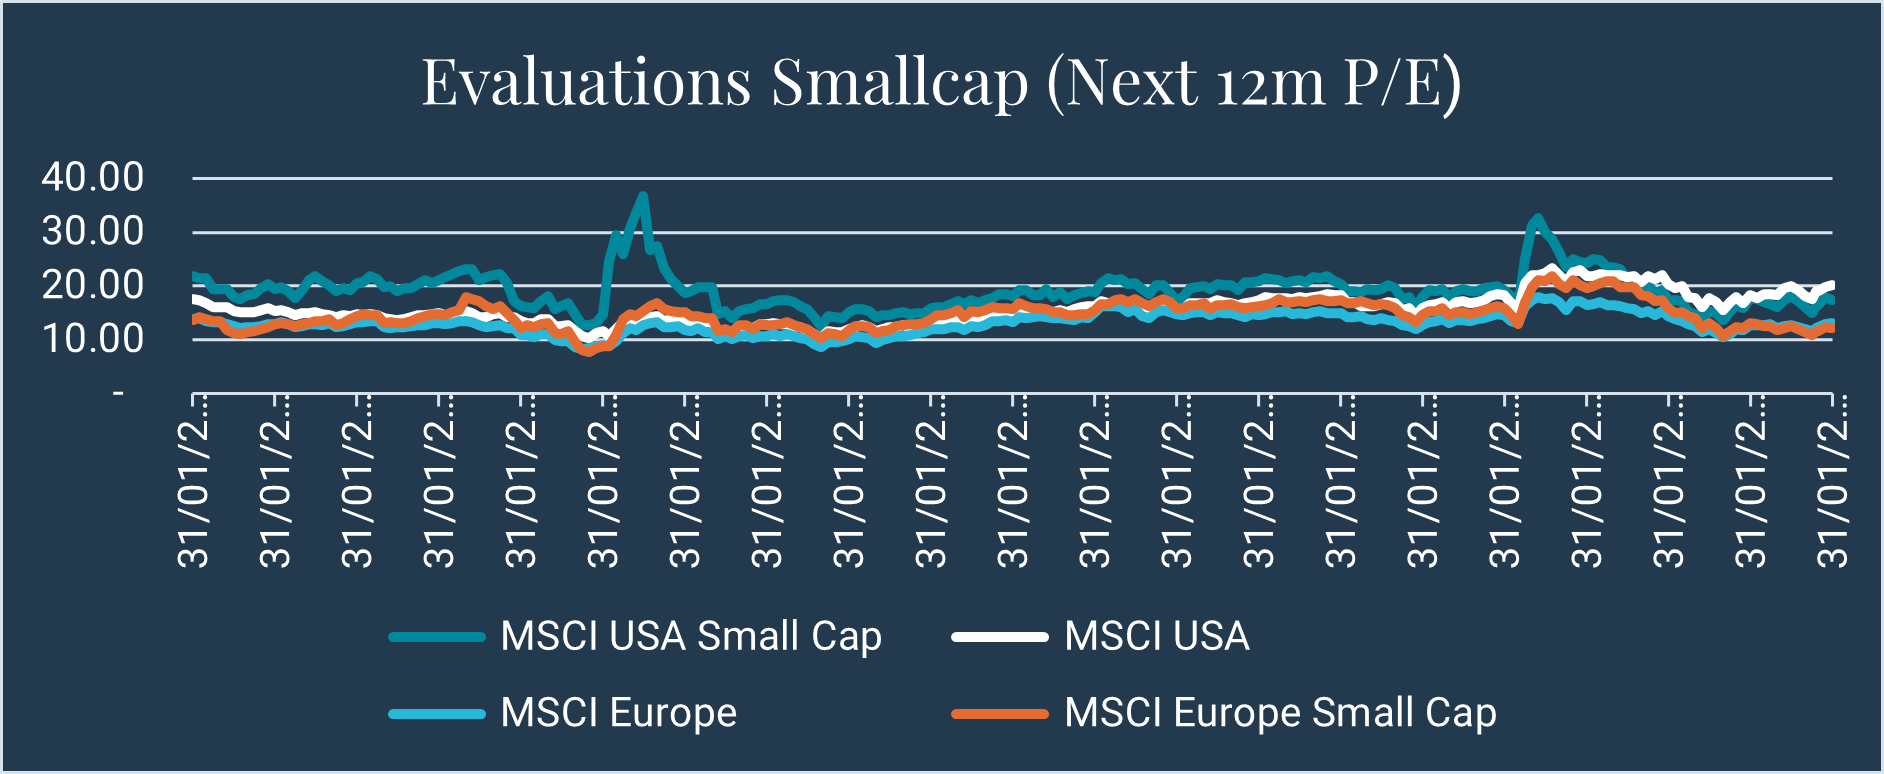
The MSCI Europe small caps currently has a P/E21 of 11.6x22 below its 20-year median of 14.6x,22 whereas that of MSCI Europe, at 12.3x,22 is slightly below its median of 12.9x.22
Small & mid caps US: playing US growth.
Seen from the United States, the developed world is sometimes limited to the U.SA. In any case, this is a bit the picture for local small & mid-caps, which essentially represent domestic securities. Another difference with small & mid caps in Europe is that those in North America are not based on innovation or even disruption. Rather, they permit exposure to fairly stable growth, based on the expansion of a quality operational model that management is gradually rolling out across all US states.
The MSCI US Small Cap currently has a P/E ratio of 16.2x23 below its 20-year median of 19.1x,23 when that of the MSCI US, at 19x23, is well above its own median of 15.4x.23
P/E of MSCI indices over twenty years.
All paths lead to small & mid-caps.
If rates have indeed reached a plateau, then European small & mid caps look like an opportunity. If North American growth behaves as Mirova has been expecting for more than a year, which is much better than the market believes, then North American small & mid caps also look like an opportunity. And if, as we believe we see, rates are falling a bit and US growth is holding up well, then all the small & mid caps will have to be reconsidered.
In a sense, one must look beyond the macroeconomic context to arrive – once again – at the same conclusion regarding this segment of the market, in particular its European component: the quest for exposure to stocks that stand to benefit from technological disruptions carries too many risks if it only materialises as carrying a few large caps. This would involve tremendous risk at the slightest disappointment on Nvidia, for example, whereas the highest appreciation potential is necessarily in smaller companies.
Another pitfall to avoid: systematically opposing large caps with small & mid caps. The latter provide a solution to complete the first, to increase the probability that a given portfolio will benefit from the growth prospects offered by the AI revolution and the changes it induces for many industries. Given current valuations, the moment seems particularly favourable to us to return to these securities. Markets have abandoned them for rational reasons, but based on circumstances that are diminishing or even disappearing.
The history of markets has repeatedly and cruelly recalled that apparent paradigm shifts leave, a few years after their invalidation, the memory of mere anomalies. The current valuation of small & mid-caps seems to fall under this category.
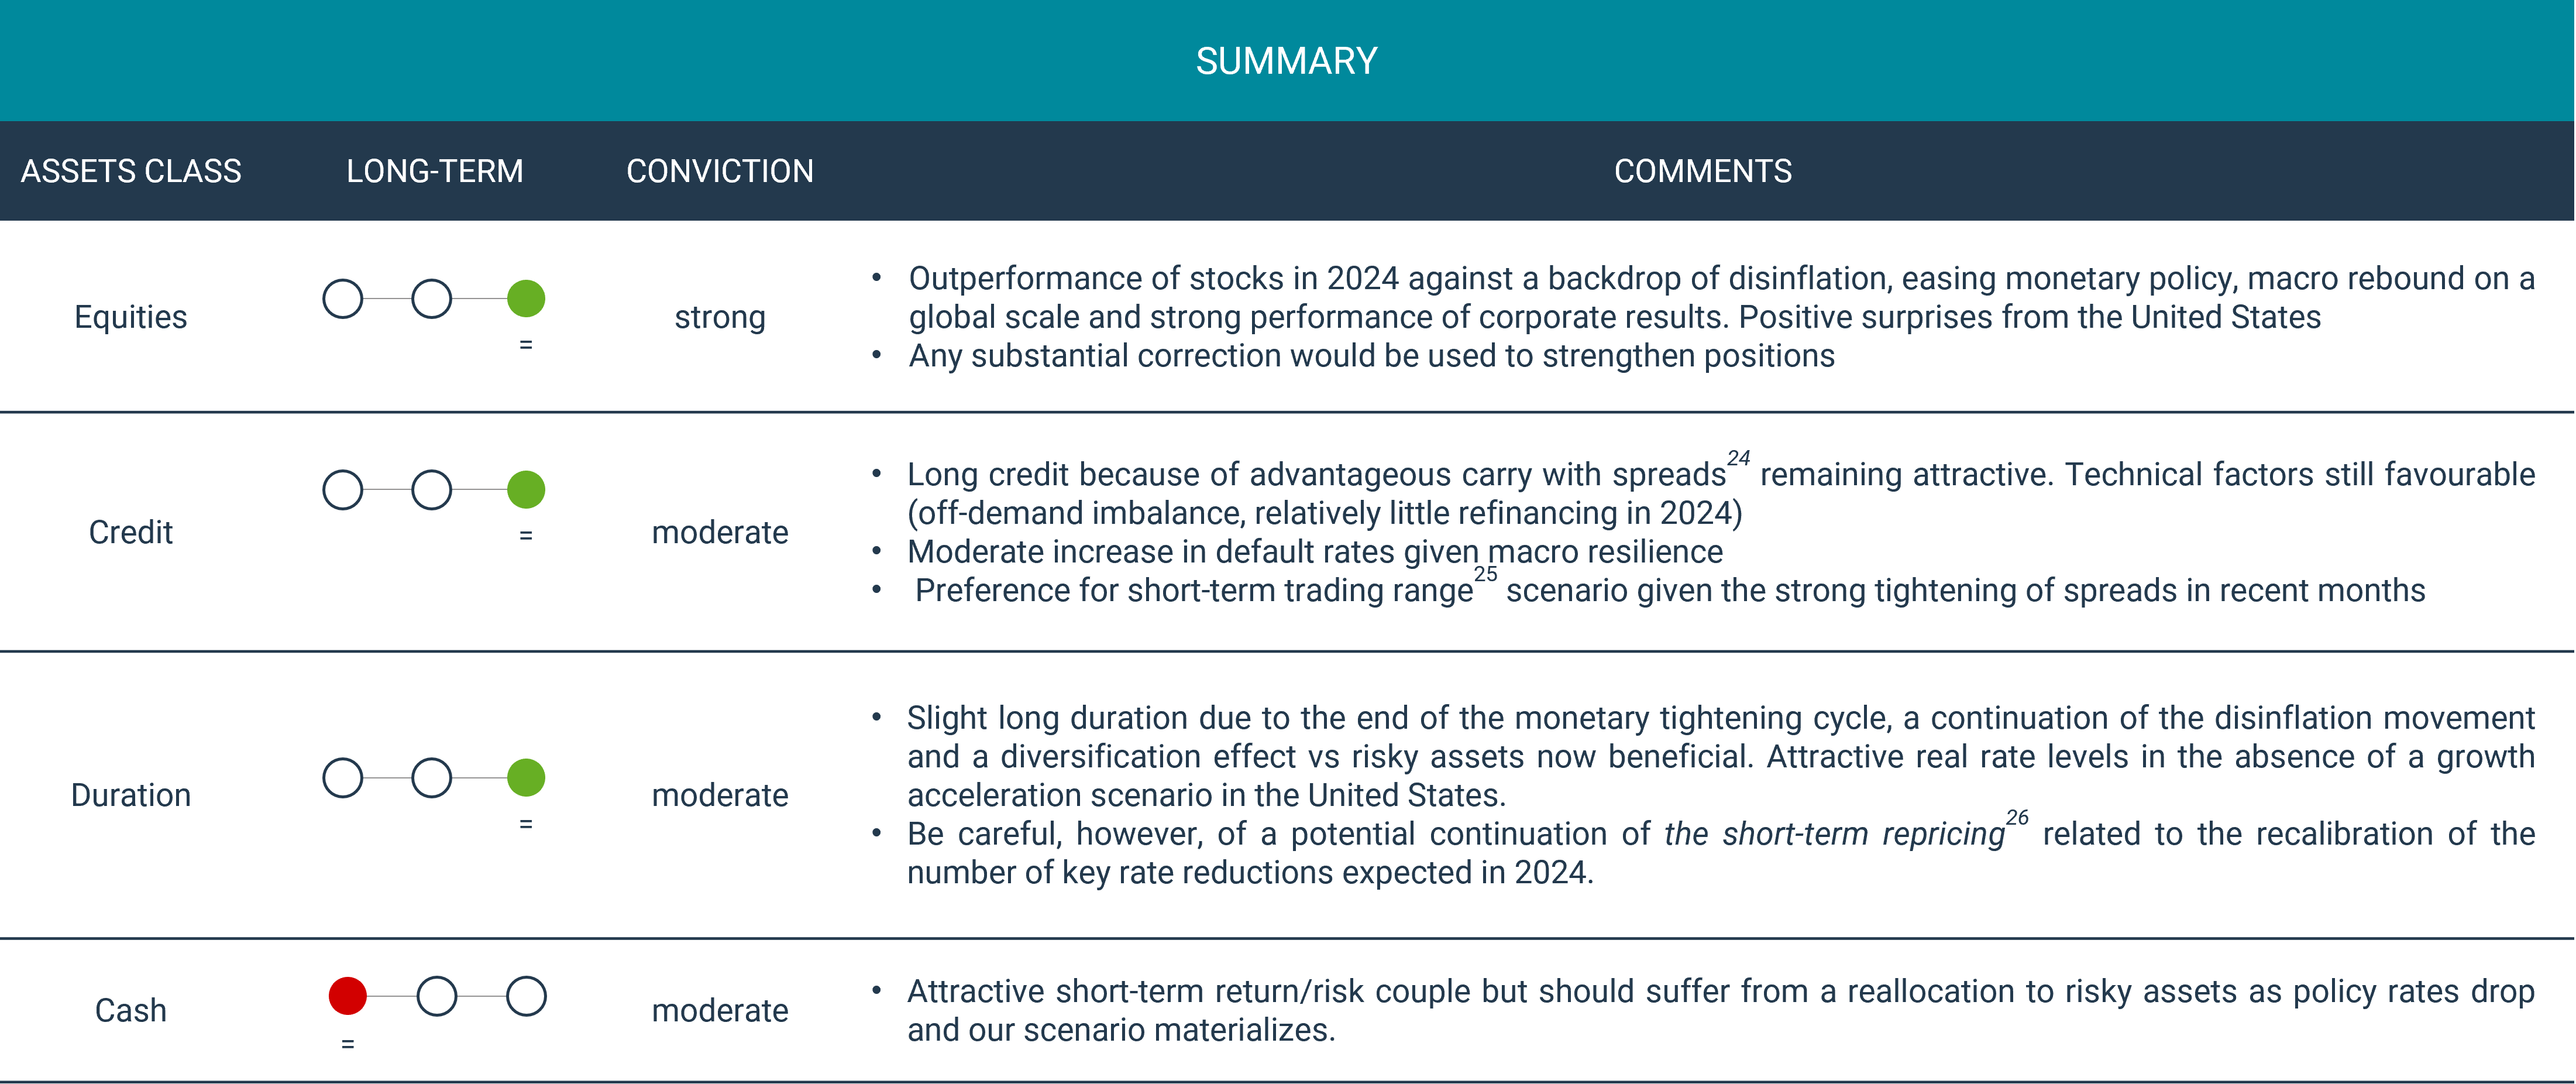
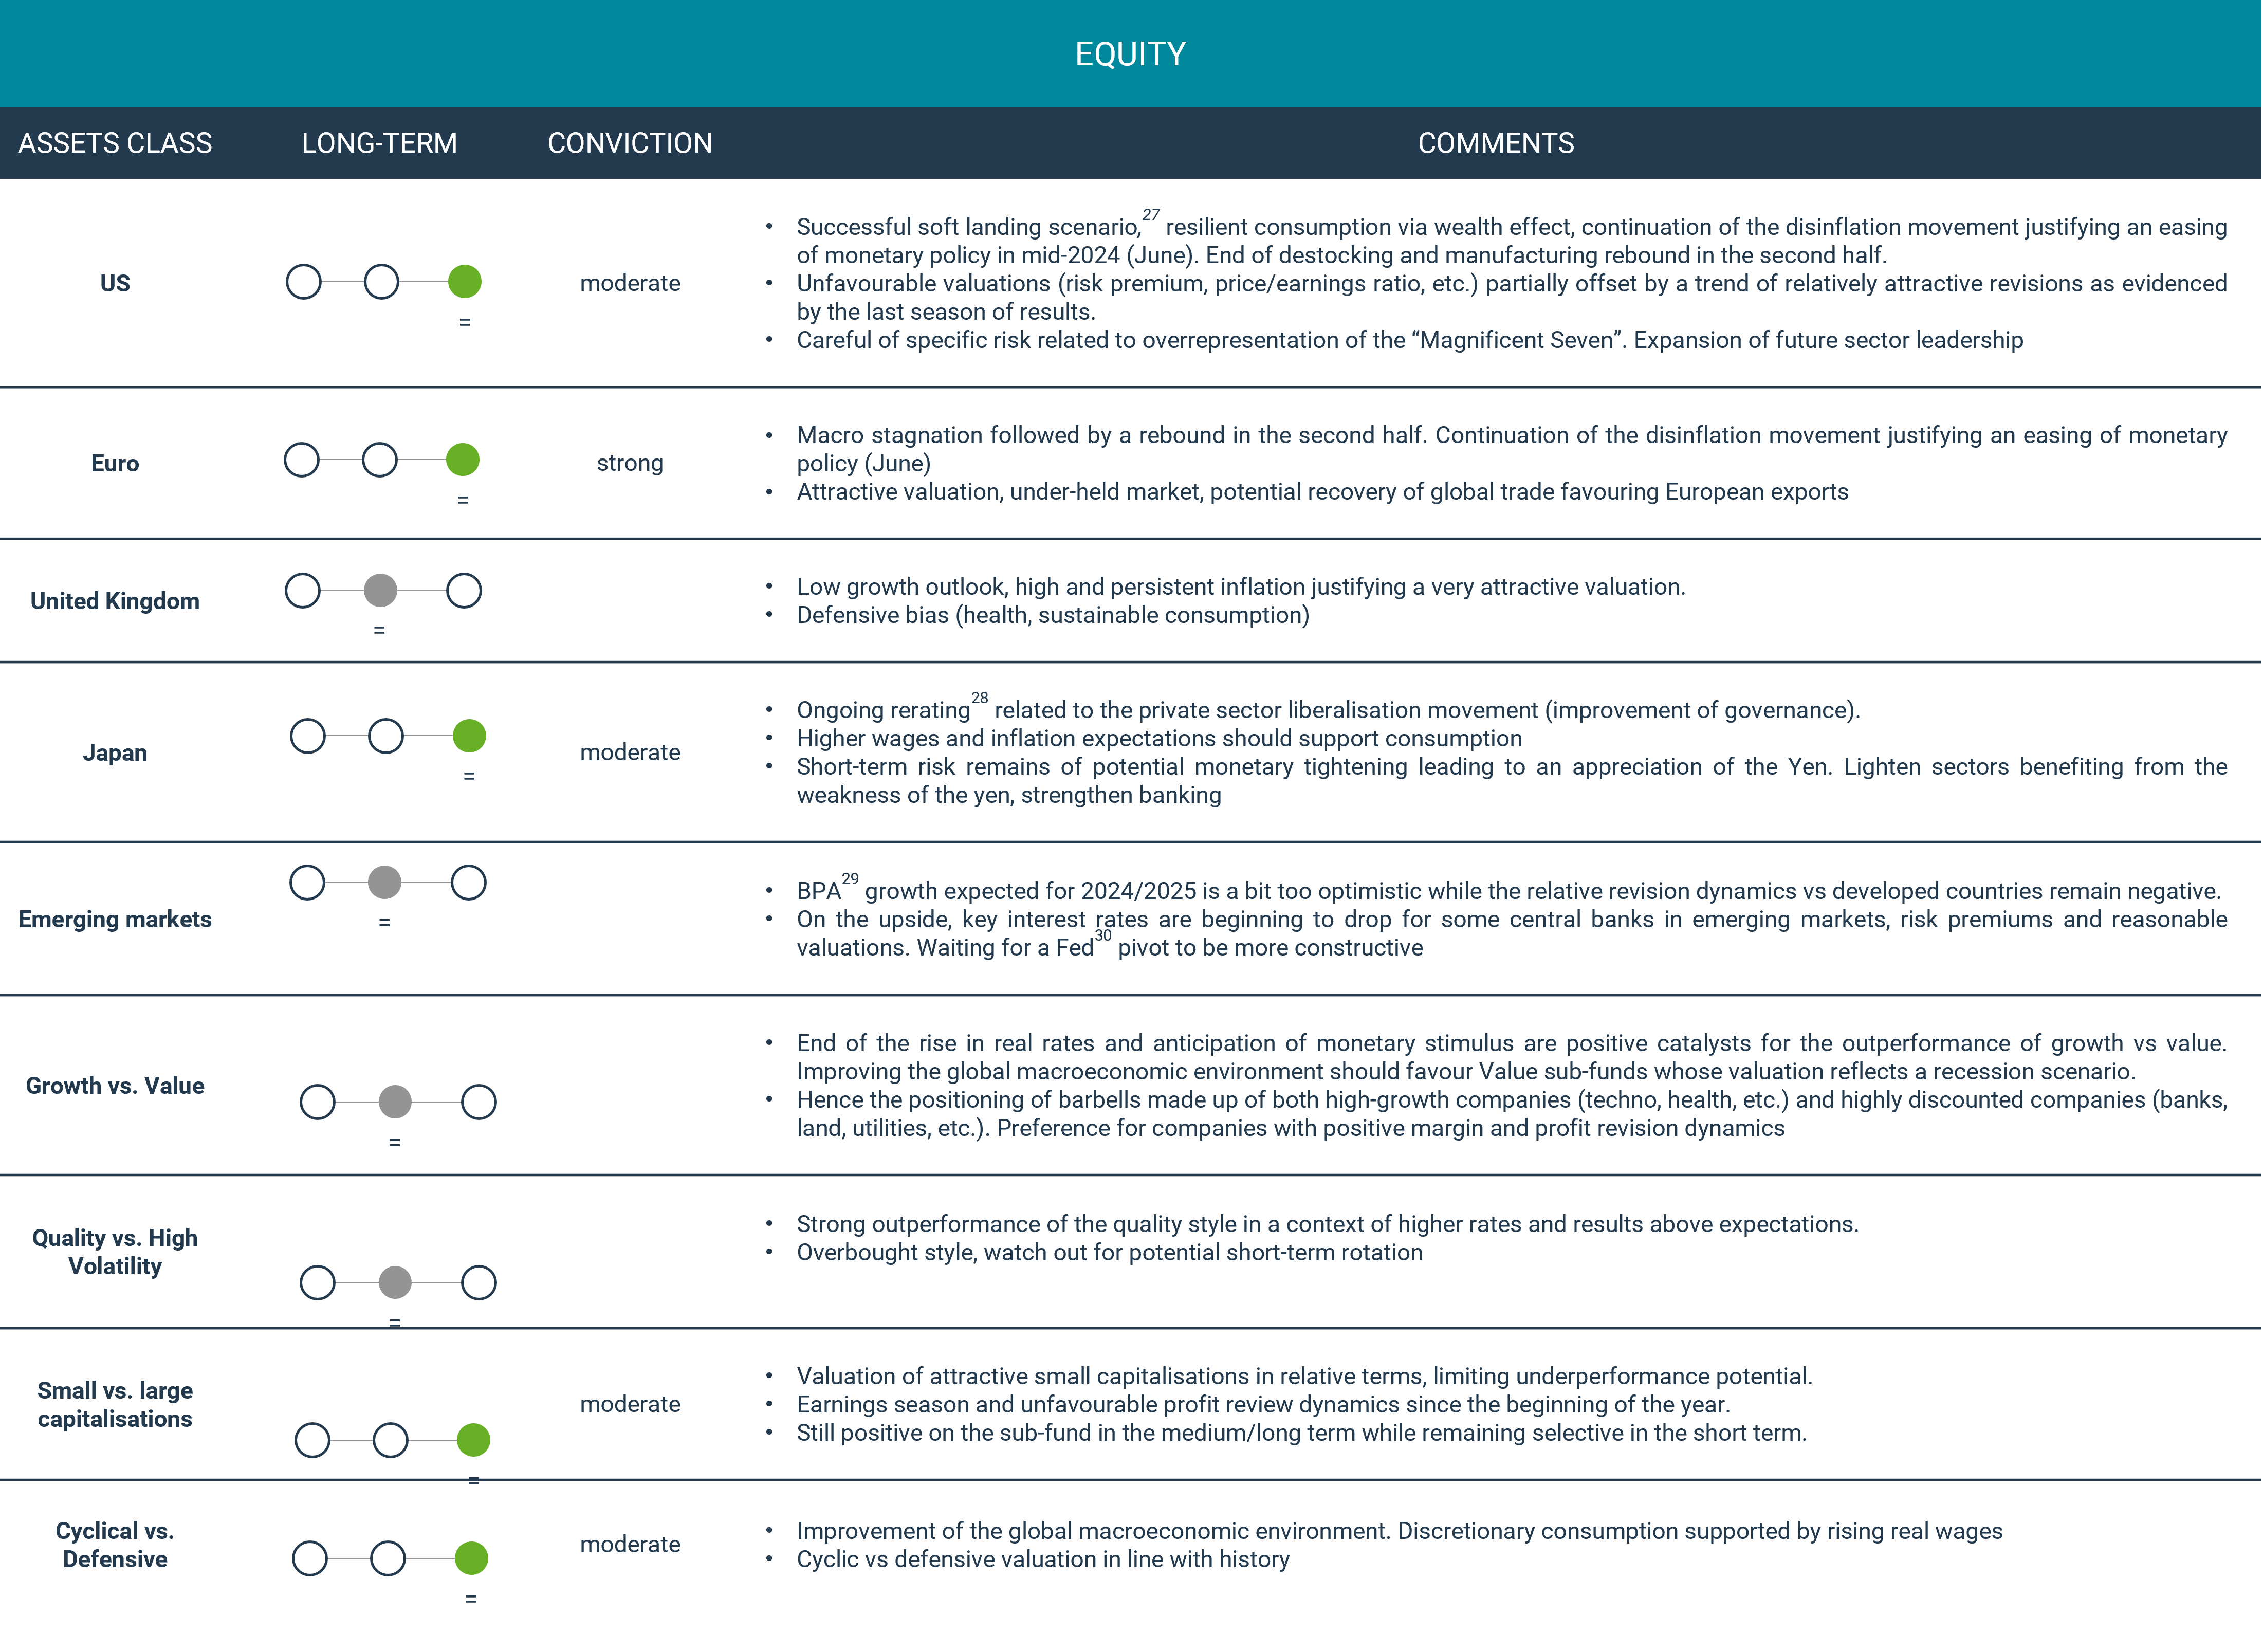
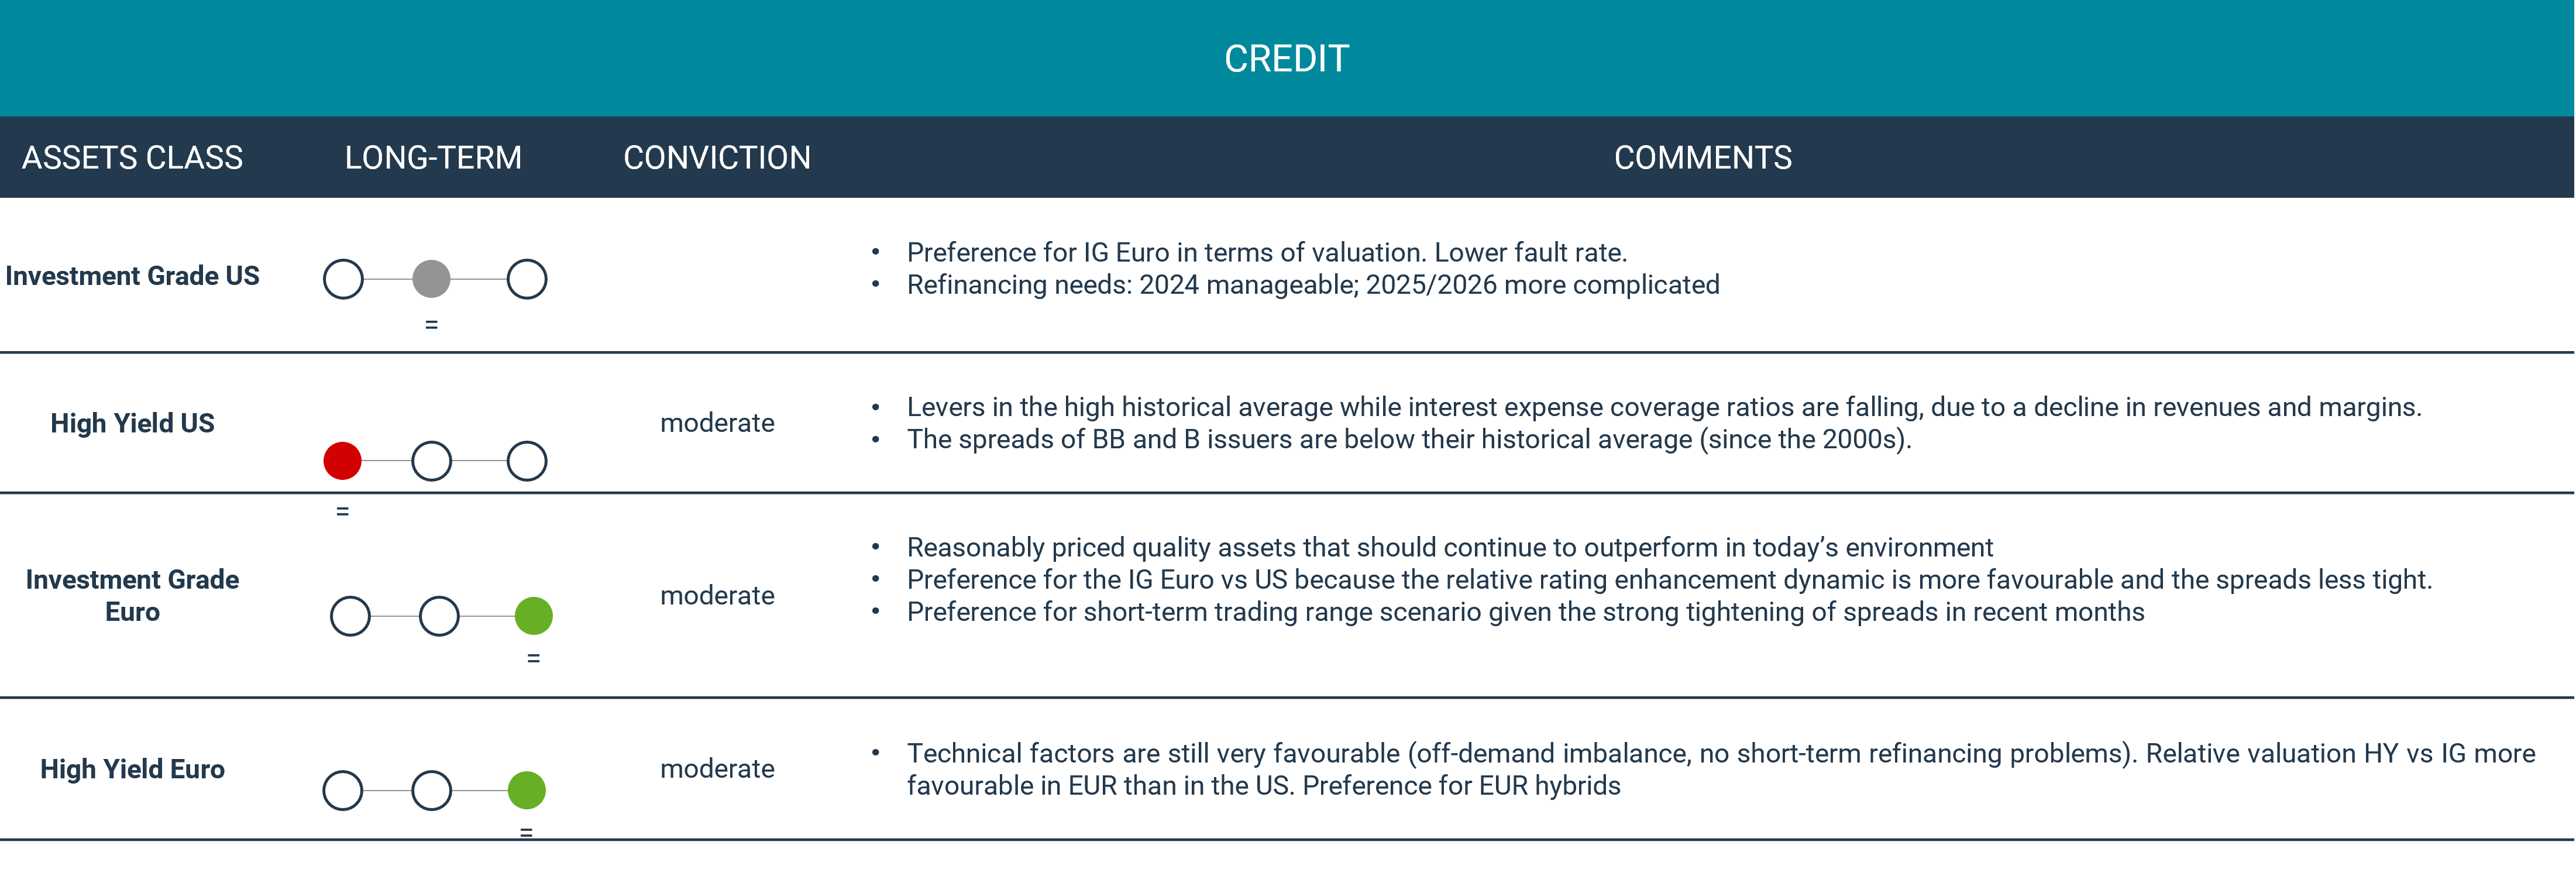
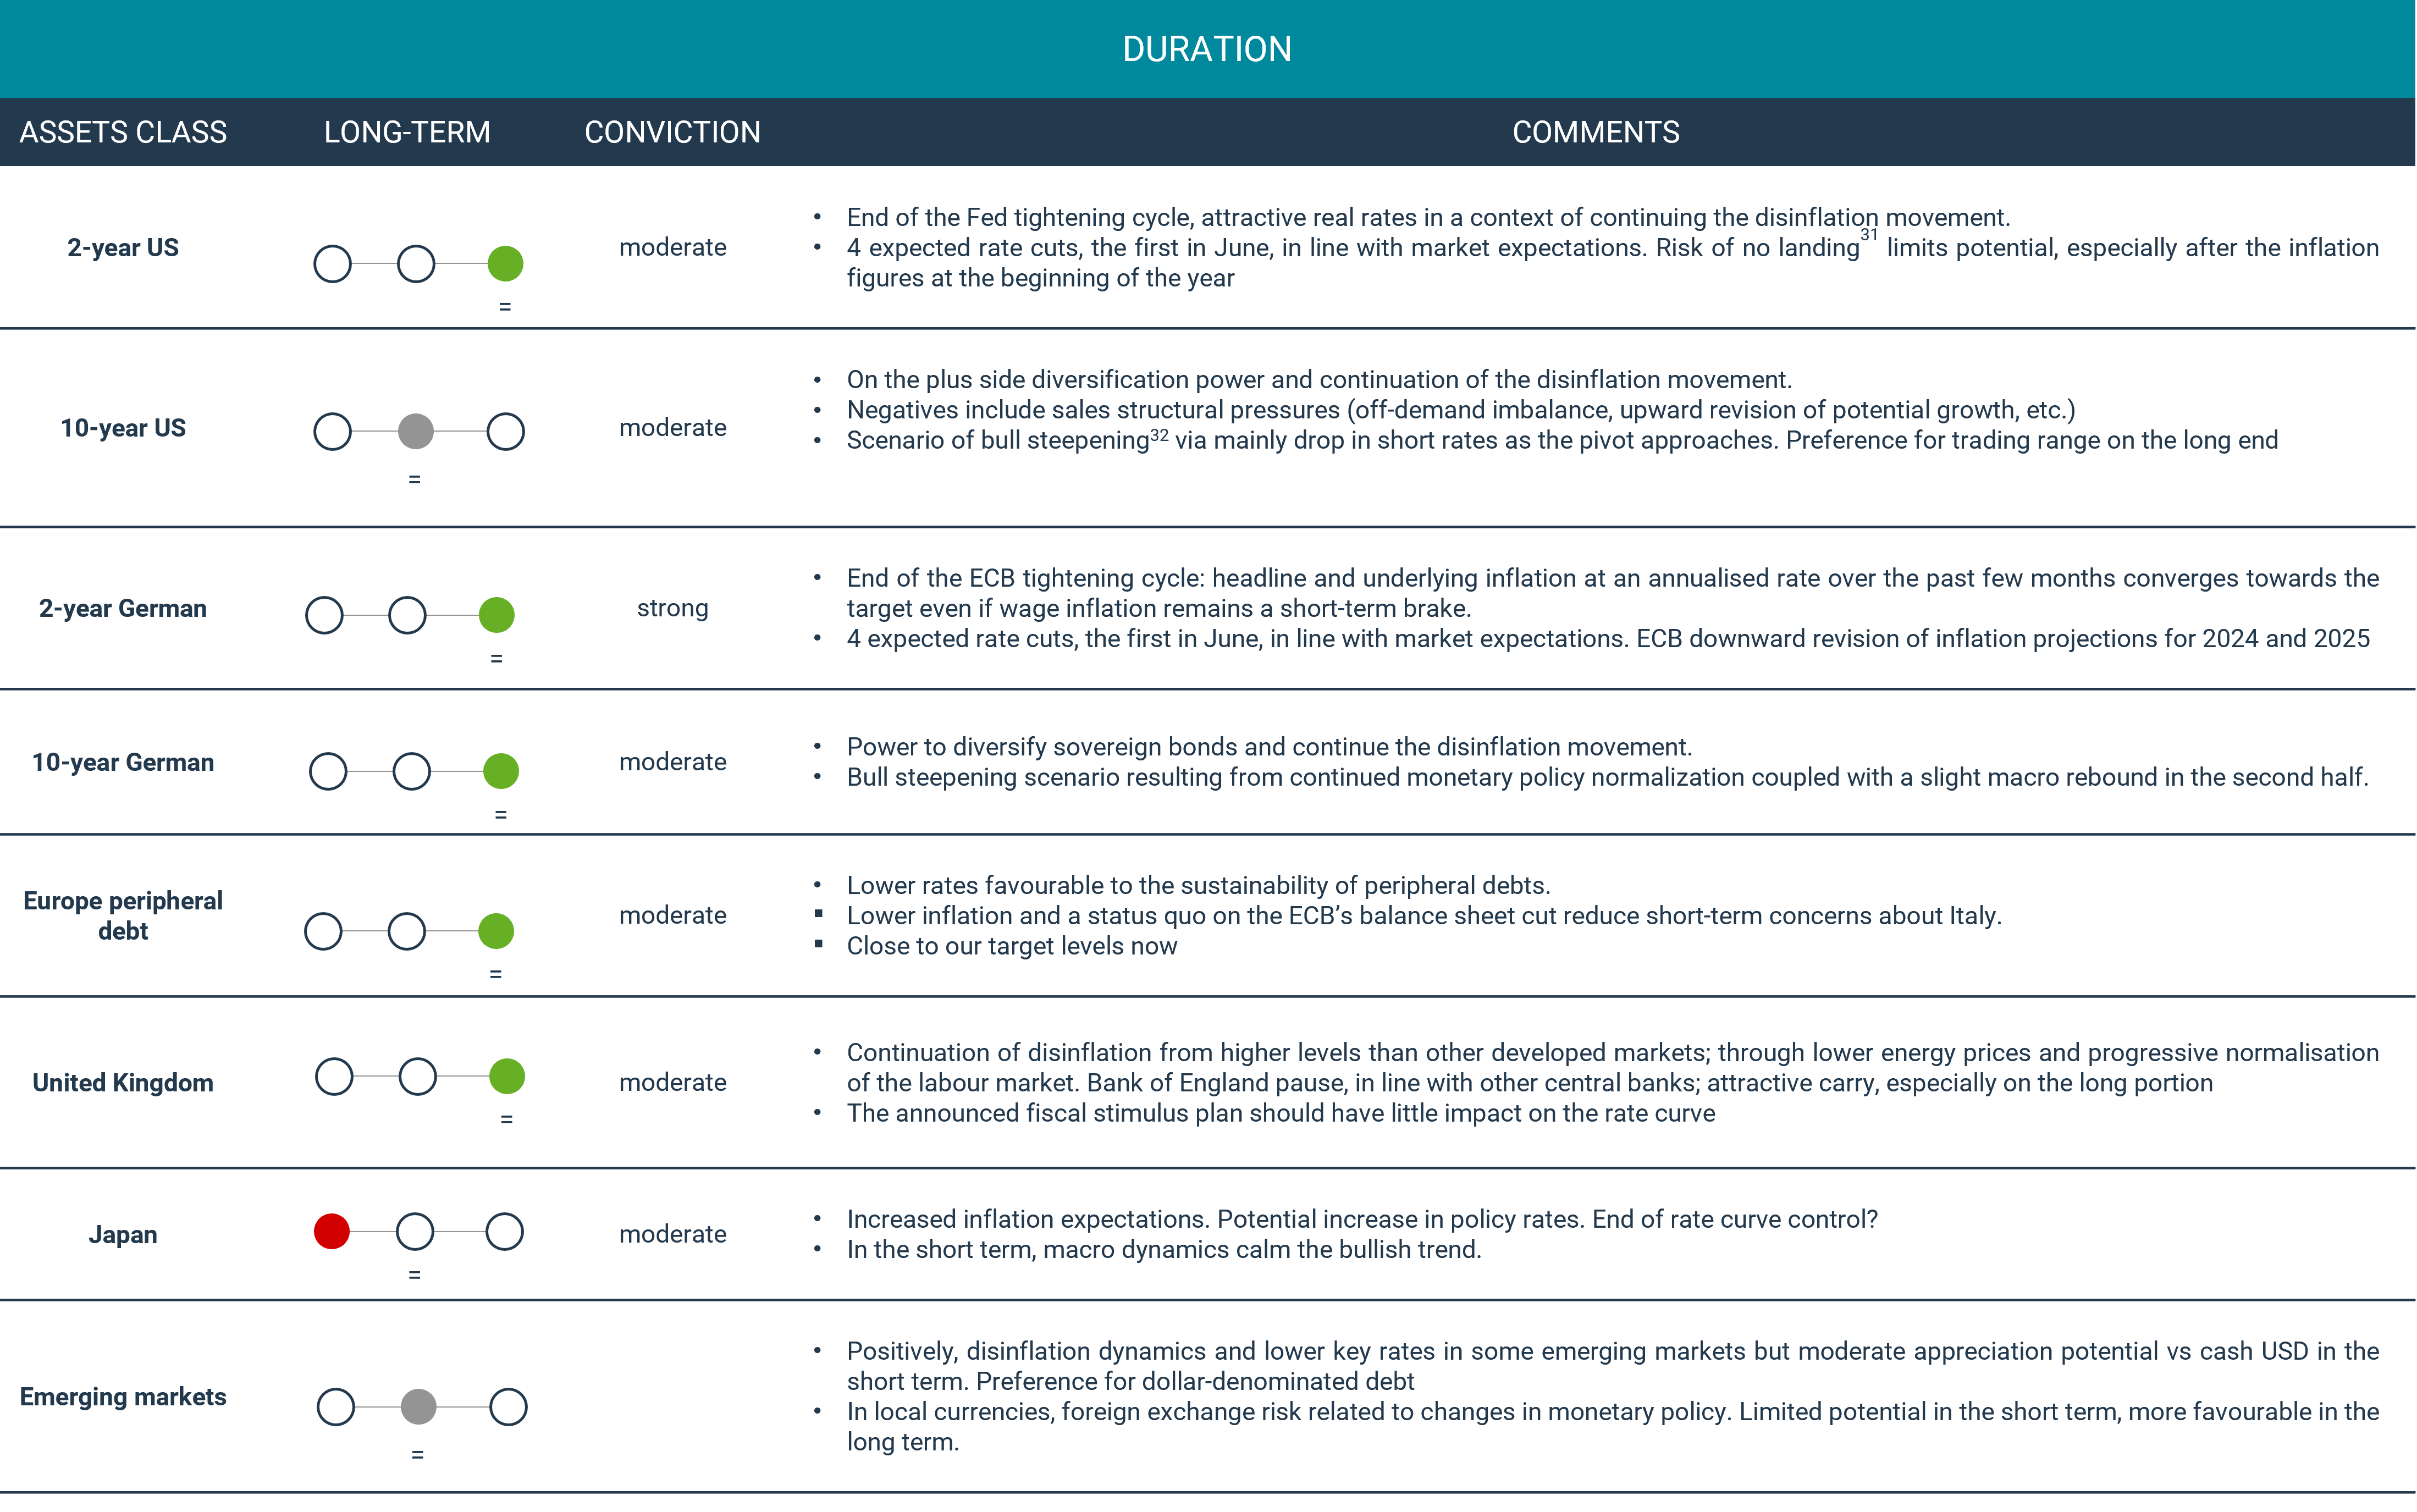
Summary of Market Views

1 The S&P 500 is a stock index based on 500 large companies listed on stock exchanges in the United States
2 Source: Bloomberg
3 Federal Reserve of the United States
4 European Central Bank
5 U.S. Treasury securities
6 Deviation
7 Ratings between AAA and BBB-according to ratings agency Standard & Poor's (S&P)
8 High yield
9 Source: Bloomberg
10 Core inflation is inflation from which some fluctuating elements have been removed
11 Consumer Price Index
12 Source: Bloomberg
13 Multi-year investment plan? Producer Price Index
14 Personal Consumption Expenditures
15 Federal Reserve of the United States
16 The Beige Book is a written report from the US Federal Reserve. Responding to the name of “Summary of Comments on Current Economic Conditions of Federal District Reserves”
17 No landing
18 Source: Bloomberg
19 European Central Bank
20 Source: Bloomberg
21 Gross Domestic Product
21 Price-earnings ratio is an indicator used in financial and stock market analysis
22 Source: Bloomberg
23 Source: Bloomberg
24 Spread is the difference or difference between the two prices of an asset in the financial sector. On the one hand we have the value of the purchase and on the other we have the selling price.
25 The Trading Range is a relevant indicator of the market especially for stochastic indicators.
26 Repricing consists of automatically changing its prices according to competition
27 Soft landing
28 Re-estimation
29 Profit per share
30 American Federal Bank
31 No landing
32 Interest rates are falling, and the yield curve is more inclined.